Django Chartjs
Django Chartjs lets you manage charts in you Django application.


This is compatible with Chart.js and Highcharts JS librairies.
Using a set of predefined Class Based Views your are able to get started after writting just your SQL query.
- Authors: Rémy Hubscher and contributors
- Licence: BSD
- Compatibility: Django 1.5+, python2.7 up to python3.3
- Project URL: https://github.com/novagile/django-chartjs
Getting Started
Install django-chartjs:
pip install django-chartjs
Add it to your INSTALLED_APPS settings:
INSTALLED_APPS = (
    '...',
    'chartjs',
)
Using it
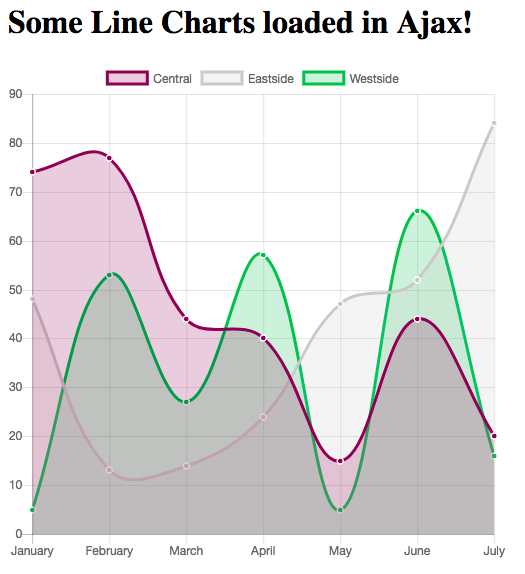
A simple Line Chart example.
1. Create the HTML file
{% load staticfiles %}
<html>
    <head>
        <title>django-chartjs line chart demo</title>
        <!--[if lte IE 8]>
            <script src="{% static 'js/excanvas.js' %}"></script>
        <![endif]-->
    </head>
    <body>
        <h1>Some Line Charts loaded in Ajax!</h1>

        <canvas id="myChart" width="500" height="400"></canvas>

        <script type="text/javascript" src="http://code.jquery.com/jquery-1.10.0.min.js"></script>
        <script type="text/javascript" src="{% static 'js/Chart.min.js' %}"></script>
        <script type="text/javascript">
            $.get('{% url "line_chart_json" %}', function(data) {
                var ctx = $("#myChart").get(0).getContext("2d");
                new Chart(ctx).Line(data);
            });
        </script>
    </body>
</html>
2. Create the view with labels and data definition
from random import randint
from django.views.generic import TemplateView
from chartjs.views.lines import BaseLineChartView


class LineChartJSONView(BaseLineChartView):
    def get_labels(self):
        """Return 7 labels."""
        return ["January", "February", "March", "April", "May", "June", "July"]

    def get_data(self):
        """Return 3 dataset to plot."""

        return [[75, 44, 92, 11, 44, 95, 35],
                [41, 92, 18, 3, 73, 87, 92],
                [87, 21, 94, 3, 90, 13, 65]]


line_chart = TemplateView.as_view(template_name='line_chart.html')
line_chart_json = LineChartJSONView.as_view()
3. Get a Chart.js Line Chart

It is that simple!
For other example, don’t hesitate to look at the demo project.
Also contribute your demo!